Contributed by: John Perkins - Senior Technical Support Specialist (Retired)
John Perkins is a manufacturing applications expert who has built hundreds of applications to help improve production and part quality. Though John is now retired, we can still answer any questions you may have at inquiries@sciemetric.com.
Unwanted noise or vibration affects customer satisfaction. It can also reveal part and assembly defects or identify a poor design.
Digital waveform signature analysis is ideally suited for NVH testing on the plant floor, to provide accurate results, traceability for continuous improvement and provide full control of pass/fail benchmarks. In this two parter, we will look at two use cases of how signature analysis was used to address quality and performance issues.
Using data to identify problems on the automotive transmission line
First up, an issue with an existing automotive transmission line audit station. The problem related to nicked gears in the transmission which made a subjective noise during operation in a vehicle. The station was fully automated, without an operator present during a typical test cycle. With no one there to hear the noise that indicated a problem, the defect would only come to light in the field.
The production station also lacked a sound isolation room where a traditional microphone approach could be used. During a plant shut down period, we completed a proof of principal test which included an accelerometer and localized microphone to compare data from both sensor technologies.
Data was captured on good and bad (nicked gear) samples and we confirmed the accelerometer characteristic signature was the same as the microphone’s. This meant a viable NVH test for the nicked gears could be performed without a traditional sound room and major test station modifications, saving significant money on implementation costs.
Additionally, the plant’s quality team now had full vibration waveform traceability by serial number thanks to our QualityWorx suite of data management and manufacturing analytics software. This limited potential exposure in a field “spill” or upstream manufacturing malfunction situation.
Not only did process signature analysis provide a reliable and fast means to determine an accurate pass/fail, it drove the deep data analysis necessary for continuous improvement across the entire line.
Digital process signature analysis in action
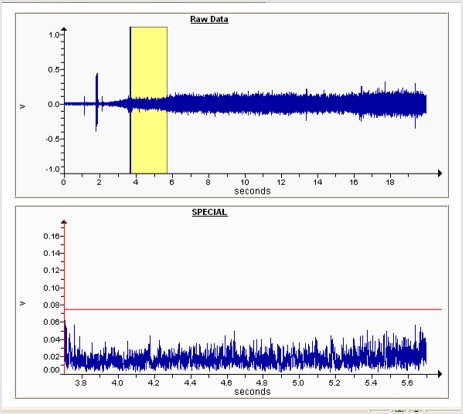
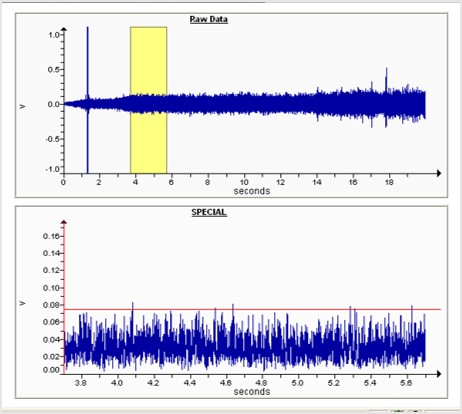
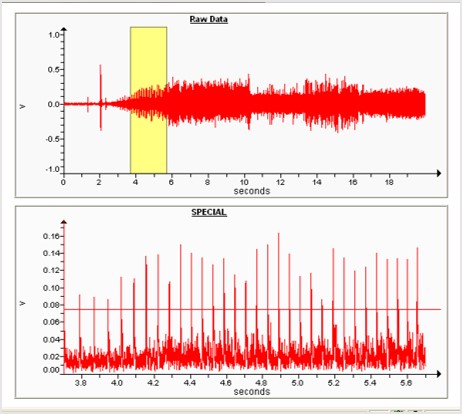
In the images below, you can see how a nicked gear reveals itself in the enhanced accelerometer processed time domain signature.
In each example, the upper curve shows the entire accelerometer signature, while the yellow box highlights the critical area of interest. The yellow feature check area was used because the leading or trailing face of the gear is only loaded during the initial acceleration or de-acceleration with minimal loading (i.e. single flank gear test) resulting in the subjective noise.

Good Part
No significant peaks in the signal.

Debris
Initially noisier but settles out and becomes indistinguishable from a good part.

Nicked Gear
Clear peaks in signal that correlate with the audible knocking noise generated by the defect.
Read NVH Testing Part 2: Ensuring smooth cruising for wheelchair drive motors.

