Contributed by: Robert Ouellette - New Product Launch Manager
When a product comes back with a warranty claim, the next step is to determine the root cause of that problem. Many manufacturers rely on SPC data to try to pinpoint where the problem occurred, but this type of data can’t always reliably identify root cause.
Tracing root cause relies on the data
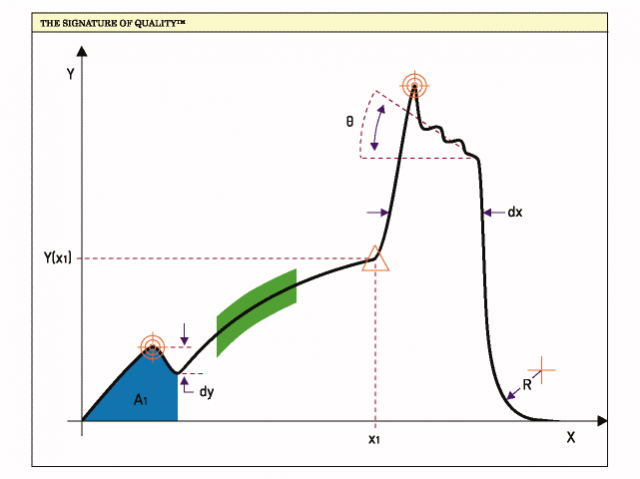
To determine which element of the manufacturing process has led to a warranty claim, the answer lies in digital process signatures, or waveforms.
Digital process signatures allow you to capture all the data from each cycle of each process and test on your production line—not just a few discrete points of data. These digital process signatures enable the creation of a digital fingerprint for every part on your production line, serialized by part number, so you can obtain complete birth history analytics.
Collecting the right data
It is important not only to collect the data, but to gather the right data into a single database where it can be easily accessed and analyzed across your entire enterprise. Having a centralized, accessible database and the right data analysis tools will mean the difference between a root cause analysis taking weeks or mere hours.
After a recall, you may have to review and compare process signatures for hundreds, or thousands, of parts or assemblies that rolled off the line in a specific day, week or even a whole month. Having the right process in place to dig through the data effectively will be key to your success.
Data visualization
Visualization is key to meaningful data analysis on your line—the interpretation, correlation and presentationof data in a manner that makes it easy to spot process anomalies.
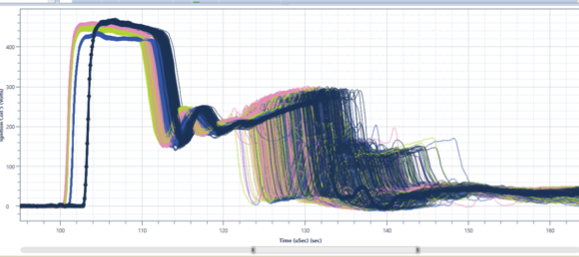
Many data analysis systems capture and store digital process signatures as flat image files. These systems lack on-demand visualization tools. Data must be exported into spreadsheets, in which each test or part has its own tab with its signature’s waveform image. There is no way to overlay and visually compare these images, which makes it time consuming and frustrating to identify outliers, especially subtle ones.
With the right data management tools, signatures can be converted into histograms that can be correlated with other data types associated with the part to illustrate the profile of a good part and the range of acceptable deviation. This makes it easy to create and visualize a baseline against which to compare all parts, allowing you to quickly spot the bad ones in the event of a recall or warranty claim.
The power of production data: Minimize the cost and impact of a recall
In one case, we worked with an automaker faced with recall costs of about $5 million due to an engine oil problem that only cropped up after vehicles were on the road. To find the problem, the automaker revisited its waveform data. A data analytics test was developed to identify the defect and understand what to look for. The problem was found to be an undrilled hole in the engine block that affected just seven engines that had incorrectly passed an end-of-line test.
Instead of recalling 10,000 vehicles, the automaker only had to recall seven. Not only did this avoid millions of dollars in costs, it mitigated the negative public relations impact with consumers.
In this case—and in many others we have encountered—having the right data and analyzing it with effective tools made all the difference in minimizing the cost and impact of a recall.
Robert Ouellette addresses this subject as part of Sciemetric’s “Ask the Experts” video series. Click here to watch this video, "How can I use production data to minimize the cost and impact of a production recall?", and more.