在现代制造业生产环境中,势必会生成巨大的数据量,但利用其带来的洞察力则是实现工业 4.0 目标的关键。Sciemetric 工作室是下一代软件系列之一,旨在快速、深入地分析整个工厂车间和企业的生产数据。包括可视化数字流程信号、视觉系统提供的图像,以及测试与监控系统提供的标量数据。仅需几小时,即可助您更快解决问题,并主动管理生产,而无需数日或数周。

工业 4.0 环境中的制造数据分析
Sciemetric 工作室提供数据驱动智能,可优化测试工作站绩效
- 钻取数据以确定零件不合格的原因
- 查看零件完整的数据历史
- 在工作站上设置优化的测试界限
- 评估测试的有效性
- 跨工作站比较信息并了解其趋势以确定变化
让制造数据发挥作用
随着工业环境中连接系统数量增加,制造商愈发意识到在快速解决问题和主动管理生产方面数据和制造指标的价值。Sciemetric 数据智能软件套件是工业 4.0 的解决方案之一,制造商希望通过它来激发生产数据的潜力,从而改进整个流水线和企业。

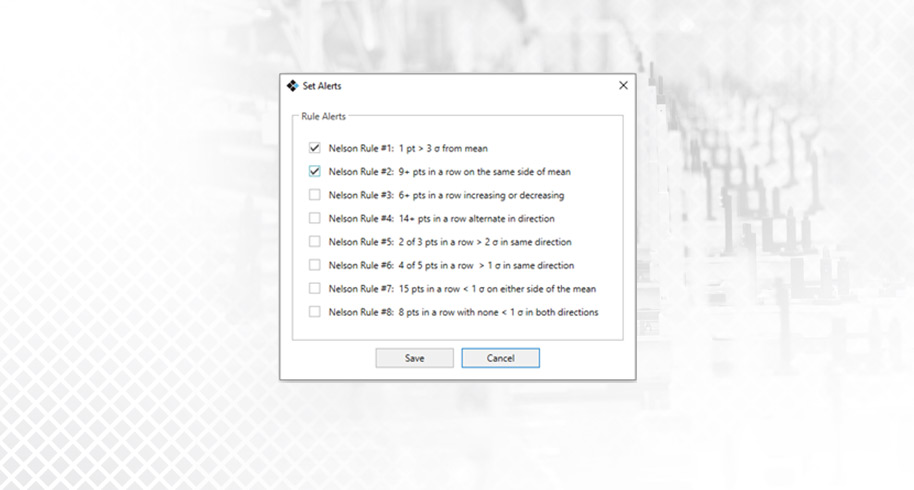
The Sciemetric Studio alerting engine provides live out-of-control data detection using Nelson rules. Alerts can be logged and sent via email if desired. You can configure which rules to apply to features and set event triggers. Watch this video to see it in action >
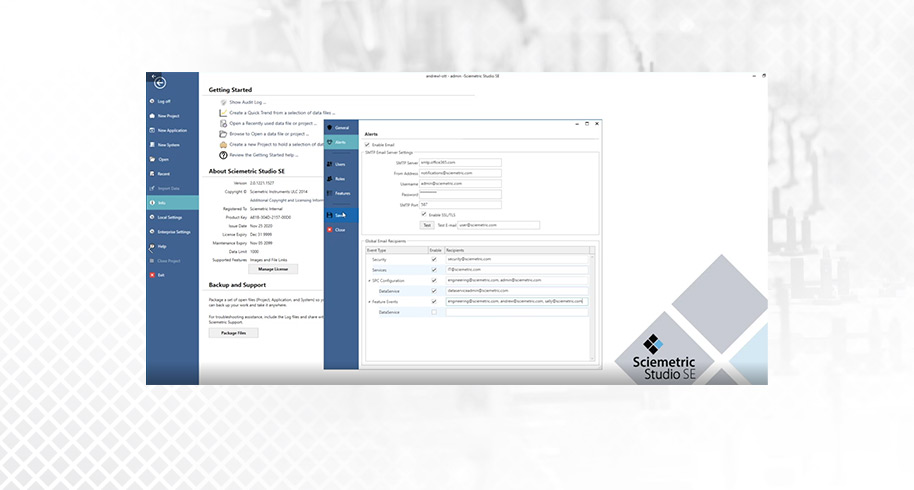
Setup and management of the alert rules are permission-based but all users can view set rules. Alert emails can be configured for various event types or the alerts can only be send to the Audit Log. Watch this video to see it in action >
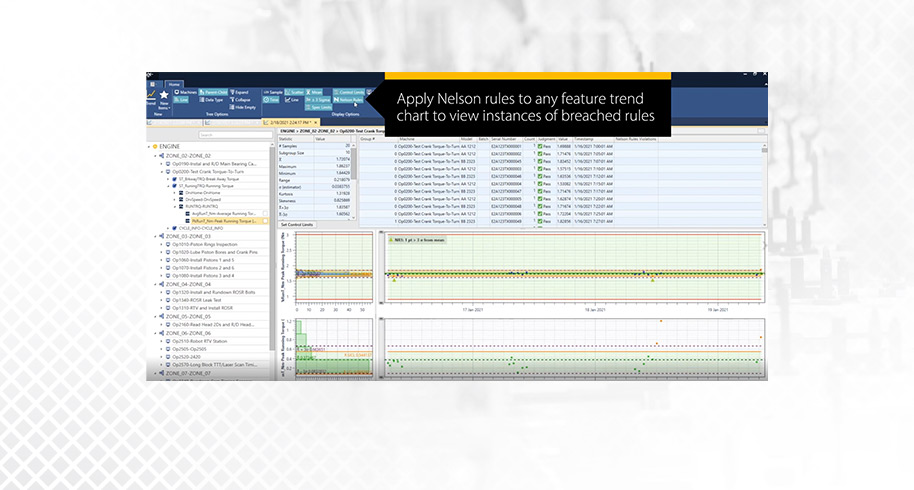
Apply Nelson rules to any feature trend chart and view instances of breached rules. User can locally set which rules to apply to the trend analysis. Watch this video to see it in action >
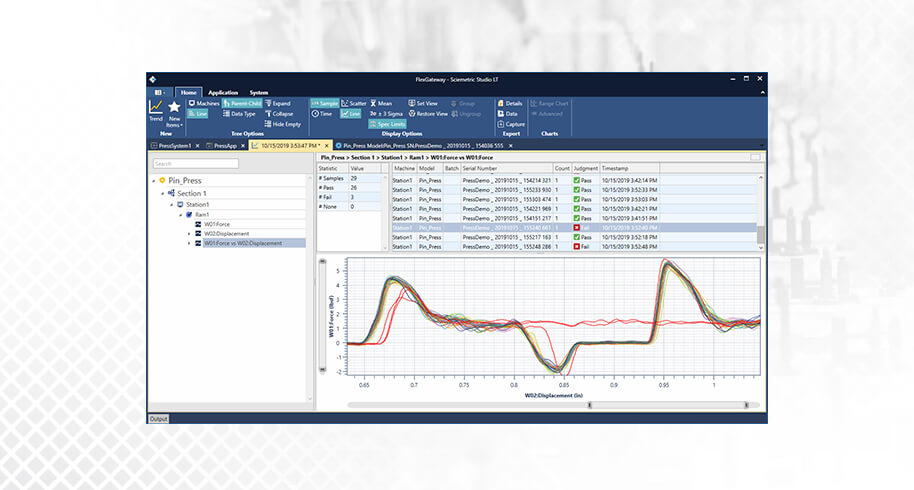
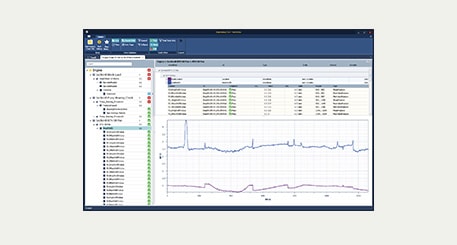
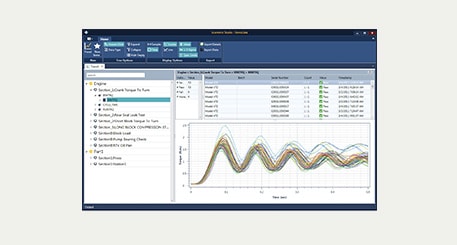
Sciemetric Studio screens displaying a waveform trend overlay to easily visualize and identify anomalies in the data to pinpoint faulty applications/processes. The anomalies (bad parts) are shown in red above, deviating from the standard, acceptable waveform. Having access to the full process waveform allows for more effective defect detection, as you catch anomalies that can occur throughout any stage of the process instead of simply at the start and finish, which can result in bad parts to go unnoticed.
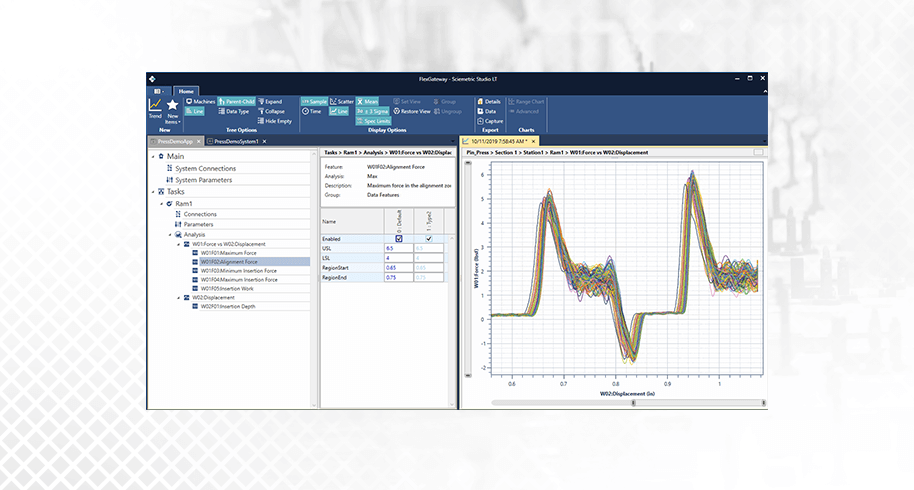
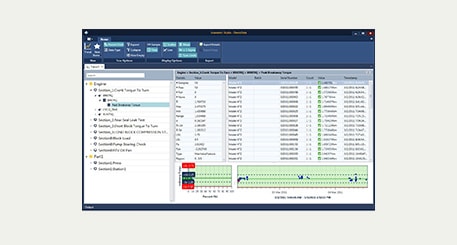
Sciemetric Studio's organized, user-friendly interface allows you to edit parameters and features of the test to better identify faulty applications and/or parts.
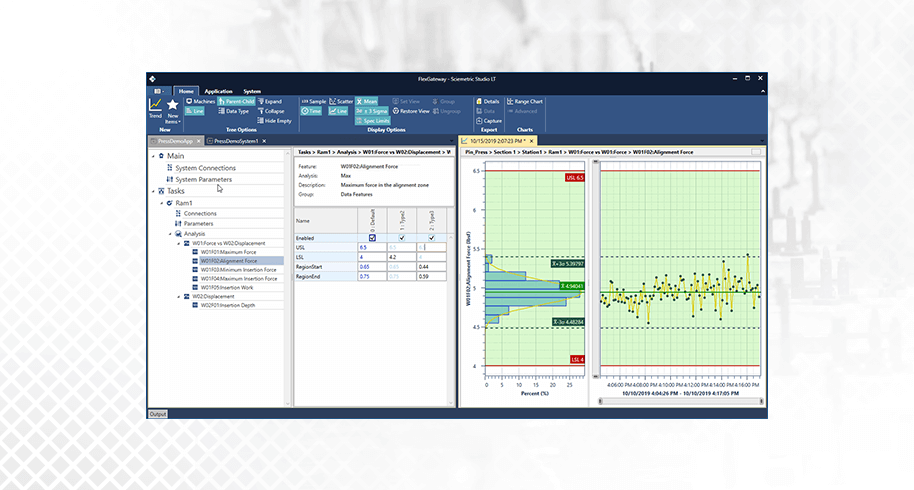
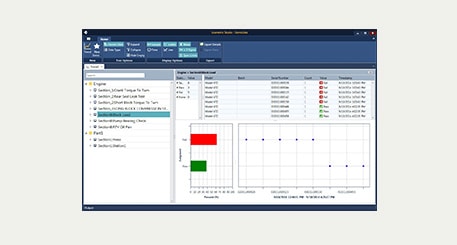
Sciemetric Studio's organized, user-friendly interface allows you to visualize and trend your data to better identify faulty applications and/or parts.
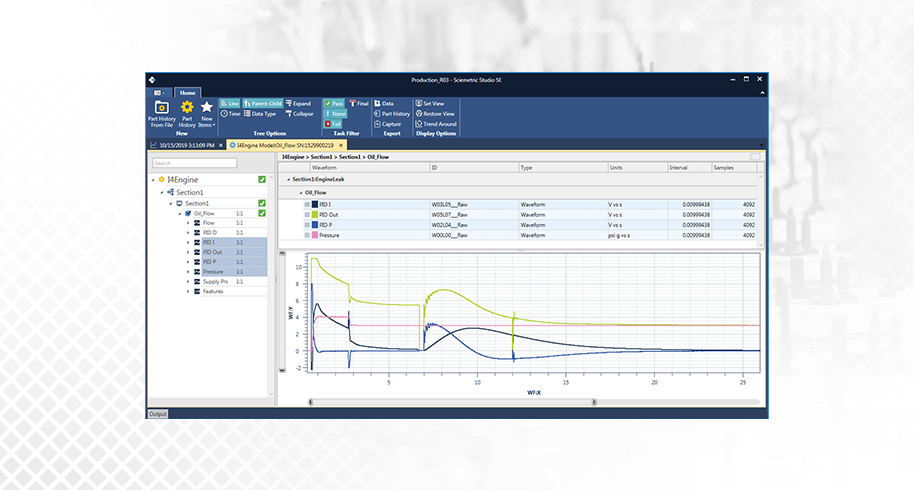
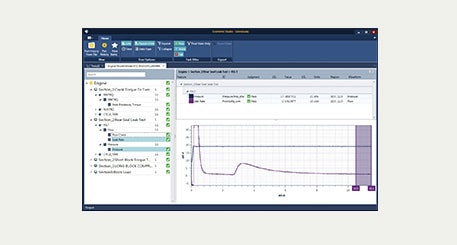
Sciemetric Studio allows you to overlay multiple waveform to dig deeper, analyzing part history, and specific points in the manufacturing process deemed critical to quality.