QualityWorX CTS DataHub 是一个由主机与 Sciemetric Studio 分析软件组成的整体平台。该平台可使您在设置完成后的几分钟内,开始收集并分析来自多达五个 CTS 泄露检测工具或 Sciemetric sigPOD 流程检测监控的实时数据。
来自检测及跨生产线流程的关联数据可提供易用格式的完整可追溯性数据和合规证明,并可就影响检测的问题,启动持续的优化和快速的响应。
Main navigation Chinese
QualityWorX CTS DataHub 是一个由主机与 Sciemetric Studio 分析软件组成的整体平台。该平台可使您在设置完成后的几分钟内,开始收集并分析来自多达五个 CTS 泄露检测工具或 Sciemetric sigPOD 流程检测监控的实时数据。
来自检测及跨生产线流程的关联数据可提供易用格式的完整可追溯性数据和合规证明,并可就影响检测的问题,启动持续的优化和快速的响应。
通过使用 QualityWorX CTS DataHub 收集并分析数据,您可从 CTS 泄露检测中获得更多信息。从检测中收集的数字流程信号或波形将为您提供改进泄露检测所需见解,从而使得泄露检测拥有更好的界限设置、更高的可重复性、更短的循环时间及完整的可追溯性等。
QualityWorX CTS DataHub 目前支持 Cincinnati Test Systems' Sentinel I28、Sentinel C28、Sentinel Blackbelt 泄露检测工具。请联系厂家,以获取支持仪器的最新列表。
请不要止步于泄露检测!sigPOD 是 Sciemetric 的站内过程监控平台,利用高级信号分析追踪制造过程,提供实时的合格/不合格反馈,并进行最先进的缺陷检测。
您可与多达五个 sigPOD 平台相连接(或与其他支持设备结合使用),从而囊括来自多种生产过程(压合、扭矩、NVH、焊接等)的检测数据。同样可收集与 sigPOD 相连接的 Sciemetric 3520 系列泄露检测仪数据。
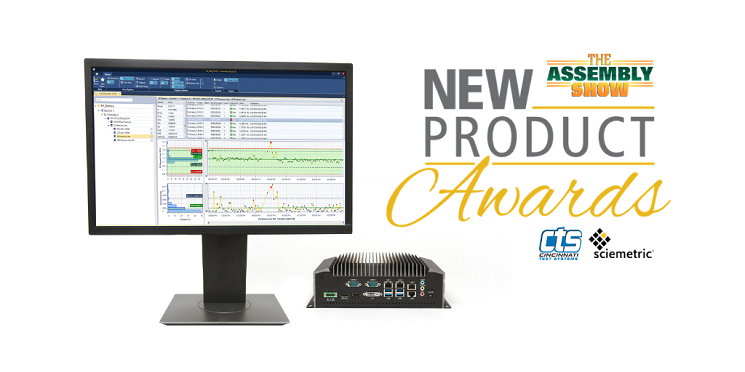
The ASSEMBLY Show 表彰 QualityWorX CTS DataHub 为 2018 年年度新产品。了解更多关于使 QualityWorX CTS DataHub 成为行业领先独特产品的信息,以在您的生产线引入工业 4.0 功能。
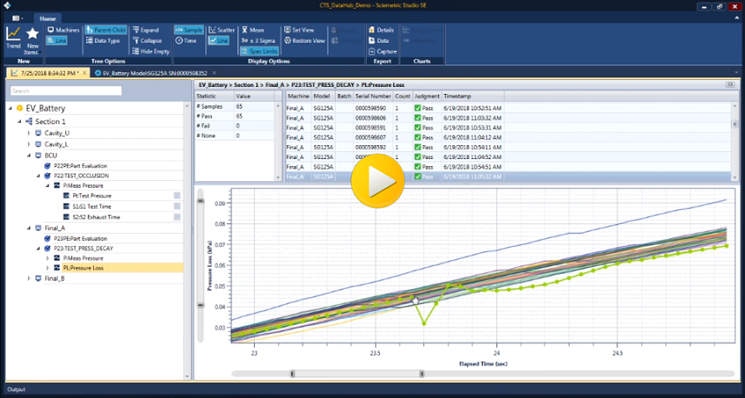
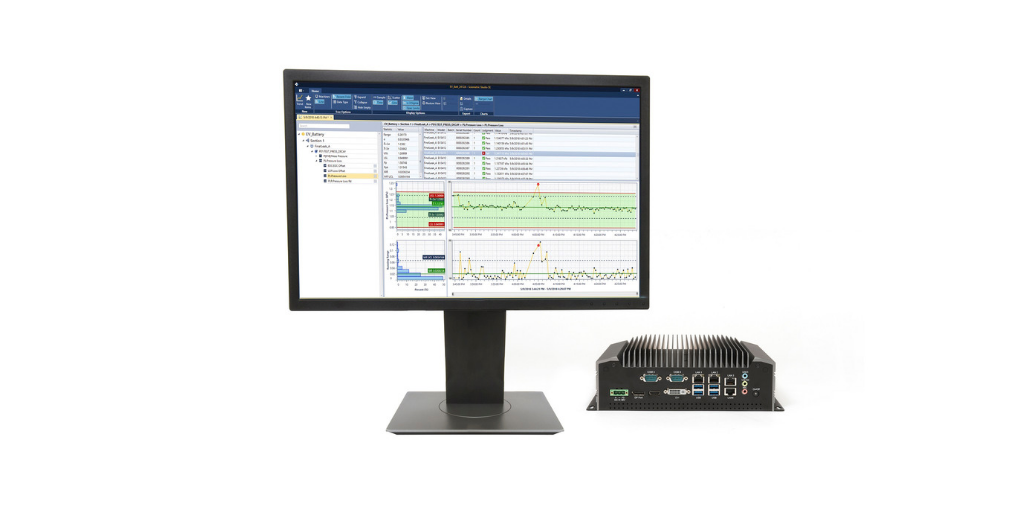
借助 QualityWorX CTS DataHub,您可近距离查看可从 CTS 泄露检测工具或 Sciemetric sigPOD 收集、分析并可视化的数据。覆盖数字流程信号时注意观察,发现异常并确定只能通过分析生产实时数据发现的问题。
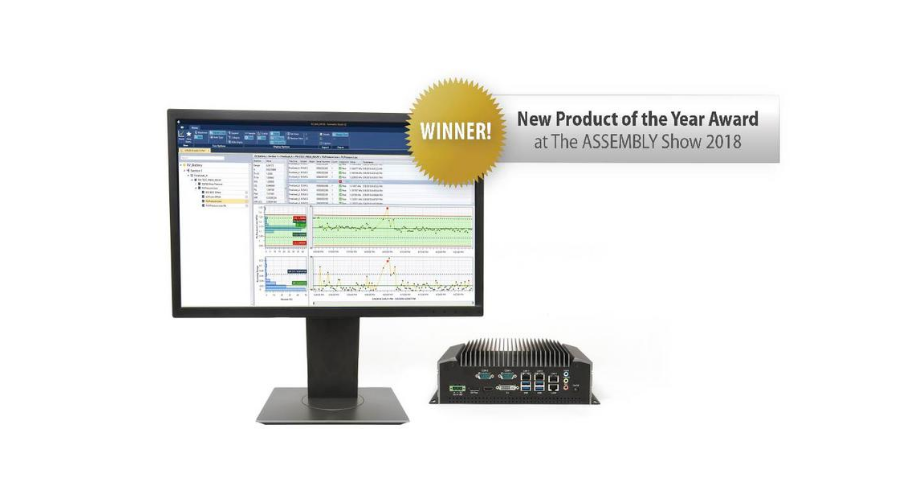
At the ASSEMBLY SHOW 2018, the QualityWorX CTS DataHub won the New Product of the Year Award in a competition among the industry's best. Click here to read the press release.
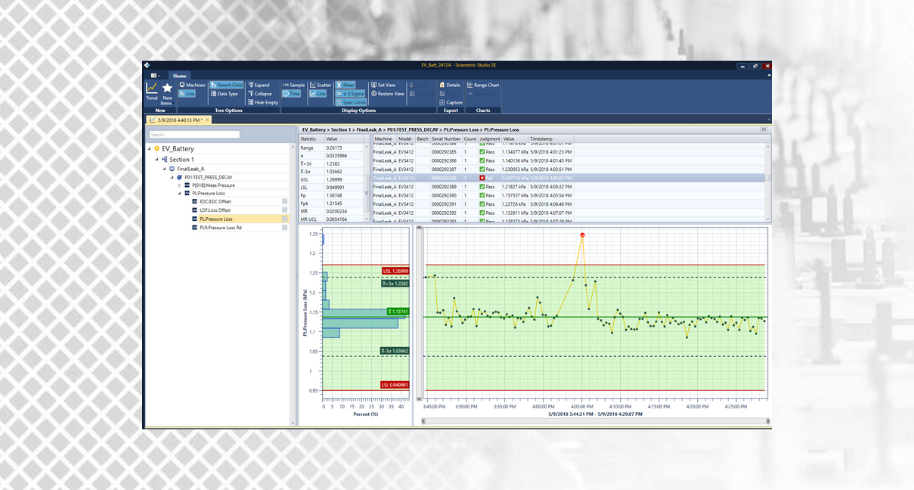
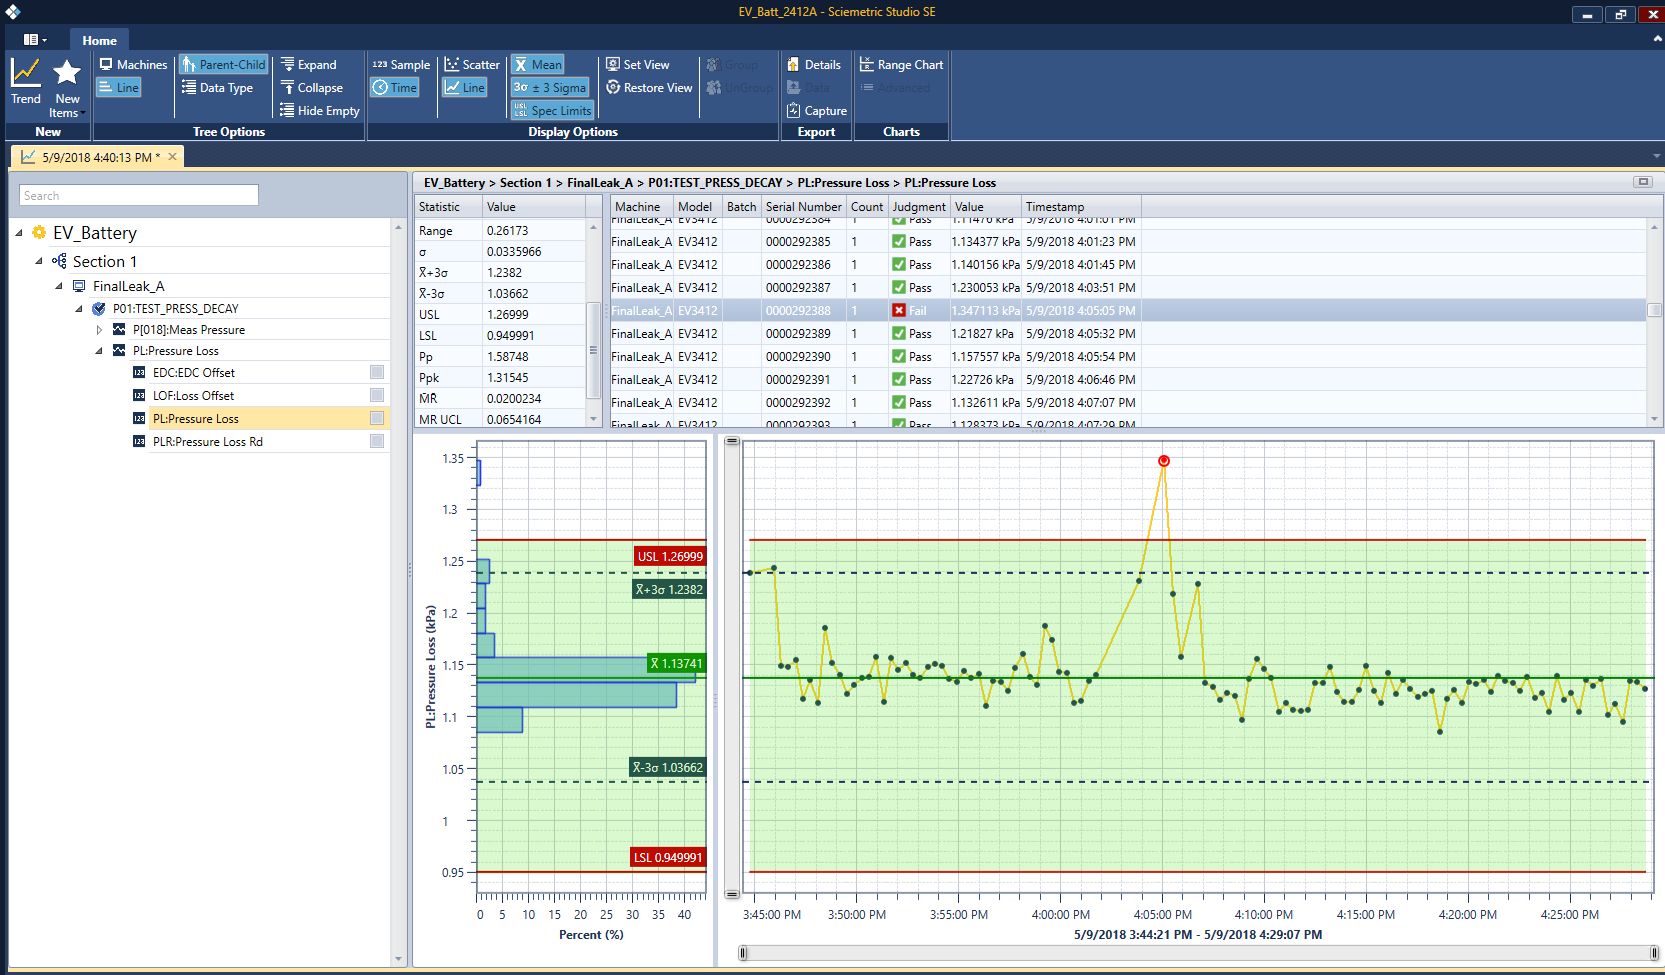
As part of the QualityWorX CTS DataHub solution, Sciemetric Studio offers an effective way to view data collected during the production process to identify faulty parts and improve your process. In this screen, we see a feature trend (pressure loss) with a highlighted failure that went outside of the set acceptable limits. As seen in this screen, you can view the exact moment of the fault in the process, allowing you to better identify the problem and prevent it from happening again.
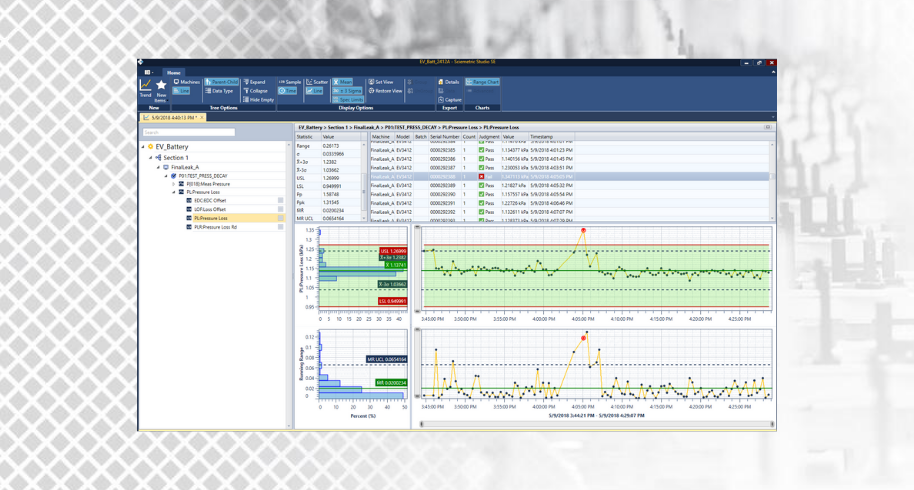
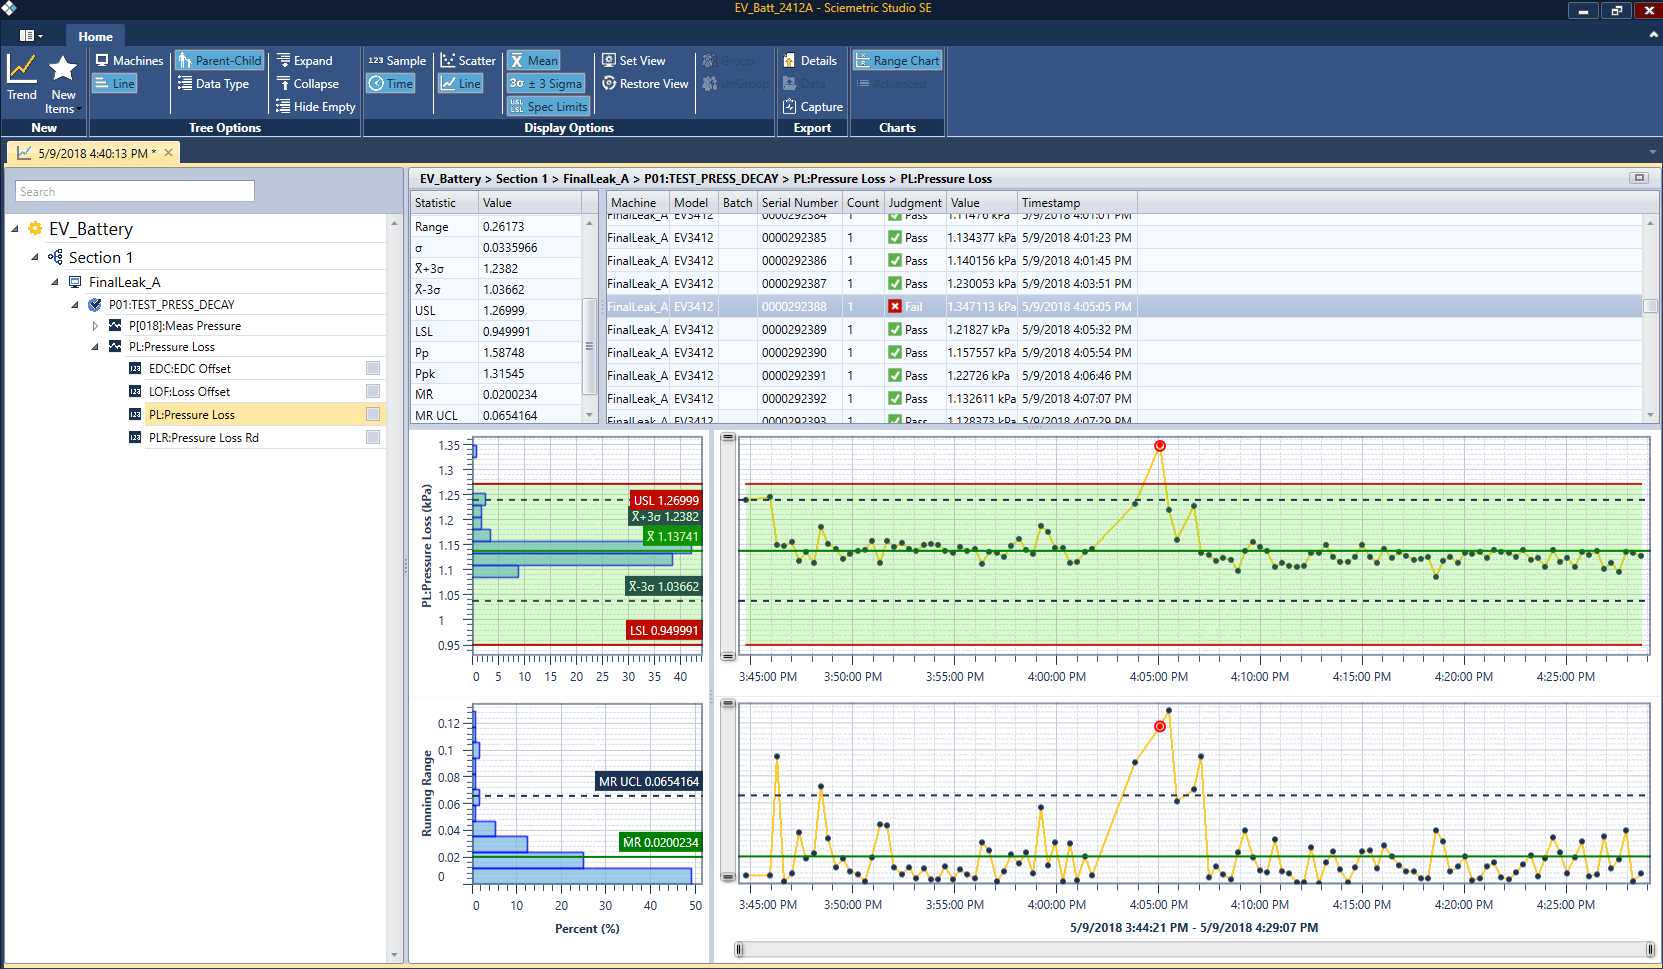
As part of the QualityWorX CTS DataHub solution, Sciemetric Studio offers an effective way to view data collected during the production process to identify faulty parts and improve your process. In this screen, we see a feature trend (pressure loss) with a highlighted failure that went outside of the set acceptable limits. Using this data, you can quickly identify anomalies by part serial number and gain insight into whether your limit setting may need to be altered for better accuracy and efficiency.
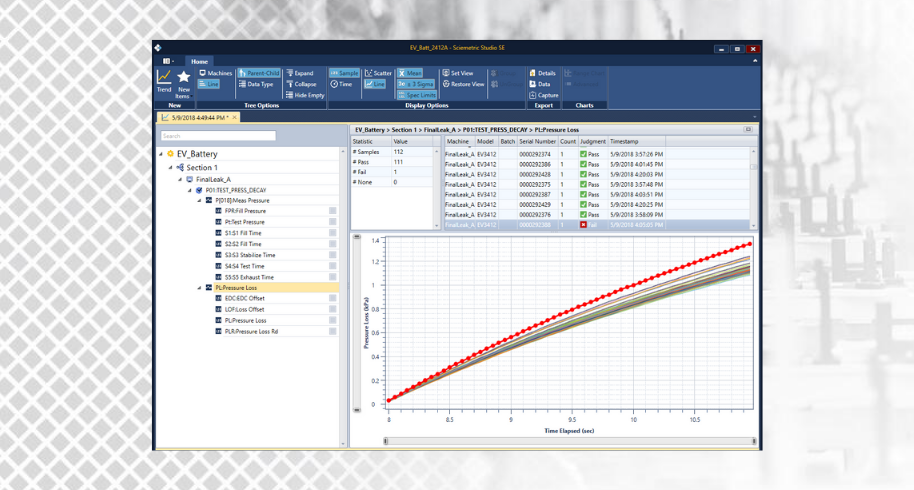
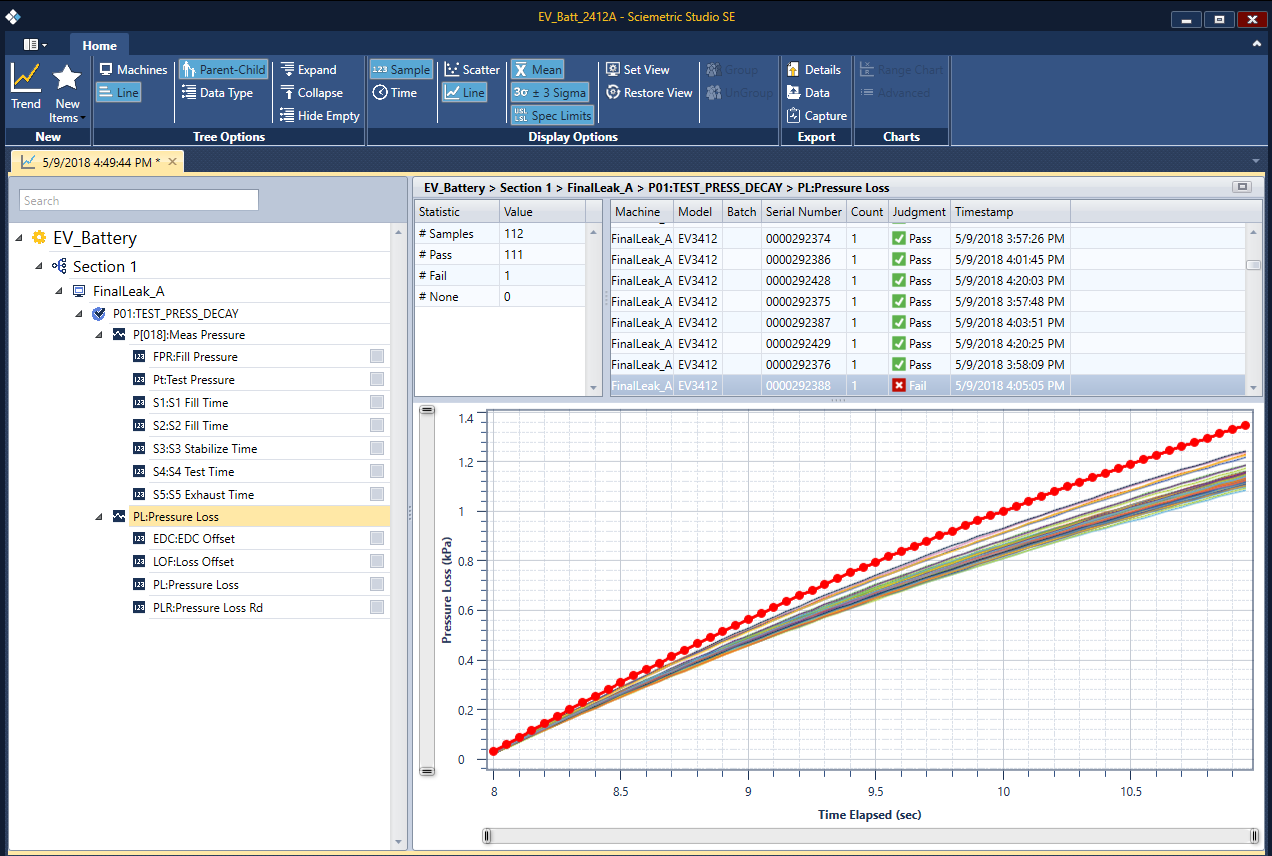
As part of the QualityWorX CTS DataHub solution, Sciemetric Studio allows you to overlay waveforms to easily visualize and identify anomalies in the data to pinpoint faulty applications/processes. This screen shows a waveform trend on pressure loss data at a manufacturing station, with the faulty process clearly identifiable (highlighted in red). This part can then be easily identified by part number and removed from the line.