Contributed by: Sciemetric Staff
Many manufacturers face the costly problem of a lagging leak test cycle time. With constant pressures on production, line managers have no choice but to run parallel test stations to maintain production quotas.
More often than not, the answer is simple—use your leak test data to better understand how the test cycle can be shortened and reliability improved to avoid wasting time and money. Here’s how one customer did it.
A common problem
One of the world’s largest automotive OEMs had a bottleneck at its end of line transmission assembly leak test stations. Test cycle times were too slow to meet production targets. In addition, the First Time Through (FTT) rates at these stations were well below acceptable percentages.
The manufacturer didn’t collect and analyze test station data. This lack of real-time insight made it difficult to understand the cause of the issue and address it.
Solution: Digital signatures provide insight
The OEM teamed up with Sciemetric and CTS for a trial. A QualityWorX CTS DataHub was connected to the CTS Sentinel I28 leak test instrument resident at one of the test stations to upload live production test data.
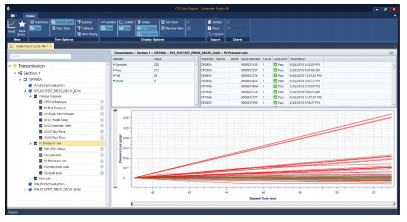
highlights those measurements that are outside the normal population
of results. In this case, the data shows substantial variation in the
measured pressure loss values across a population of test results.
After 100 parts in production were leak tested, the collected pressure waveform data was analyzed in Sciemetric Studio, (the advanced analytics software included with the QualityWorX CTS DataHub).
The verdict? A valve within the transmission assembly may not have been opening, which caused slower pressurization of the torque converter cavity. This made for a longer test cycle and also compromised test reliability.
This information gave the quality team the insight they needed to fix the problem, by adjusting fill pressure and fill time. These tweaks helped to sufficiently pressurize the entire transmission to the state of equilibrium required for a reliable test. Increasing fill pressure and fill time also mitigated the impact of the air interacting with the transmission fluid, which was causing additional variability in the test results.
Result: Double-digit gains that speak for themselves
After the program was optimized, the manufacturer ran two hundred more parts through the leak test. The resulting digital process signatures clearly indicated that the combination of higher pressure fill and extended fill time provided a much more stable and reliable test.
Particularly interesting was that increasing fill time didn’t increase overall cycle time. In fact, the net result was a test cycle 14 seconds, or 21%, shorter than before. FTT also increased by 11.5% compared to a parallel station that had not been modified.
This gave the OEM the data-driven insight to not only shorten cycle time and boost FTT at this one test station, but to make similar improvements at all the CTS leak test stations on the line.
To learn more about the QualityWorX CTS DataHub, click here.