Sciemetric Studio is a family of Manufacturing 4.0 software designed to enable quick, in-depth analysis of production data from across your plant floor and enterprise. With Sciemetric Studio, you can produce manufacturing reports that help you analyze trends and find deviations in your process before they affect downstream production. Within hours—not days or weeks—you’ll be resolving issues faster and proactively managing your factory.
With the latest release, Sciemetric Studio provides even more data-driven intelligence to optimize your station performance:
Monitor production data for real-time process trending alerts
Drill down into data to determine the cause of a part failure
View the complete data history for a part
Optimize test limits
Evaluate the effectiveness of a test
Compare and trend information across stations to determine variations
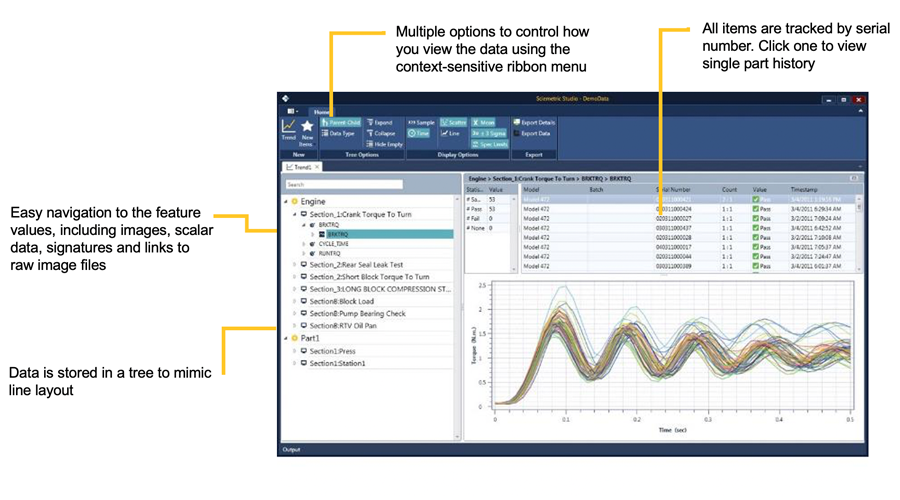
Sciemetric Studio reporting and analysis tools, organized and viewable on a part-by-part basis by serial number
Insightful reporting on part assembly processes, now with real-time SPC
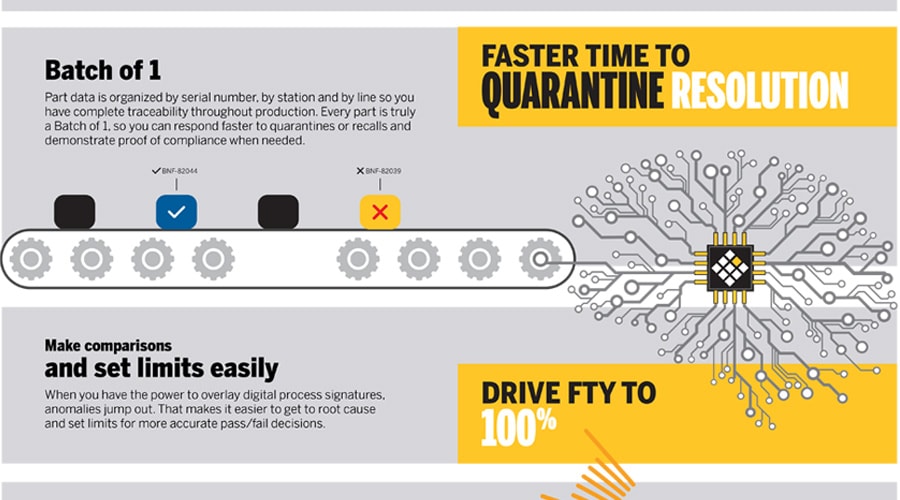
Sciemetric Studio offers manufacturers a faster path from analysis to answer. Real-time SPC warns of process deviations while analysis of part-specific data establishes the root cause of the issues more quickly. Data is organized to follow product line flow and can be analyzed by serial numbers, lots, and shifts, etc. The displays make it easy to visualize and make sense of the information.
Scalable data analysis for the production line
Sciemetric Studio comes in two tiers. Depending on your data analysis needs, you can choose Studio LT, which gives you simple and quick data review from a few stations, or Studio SE, which supports larger local or enterprise-wide data analysis.
See it in action! Manufacturing analytics at your fingertips
Real-time alerting engine for real-time data monitoring
Watch how easy it is to apply alerts and start using Sciemetric Studio's new real-time alerting engine for continuous real-time data monitoring.
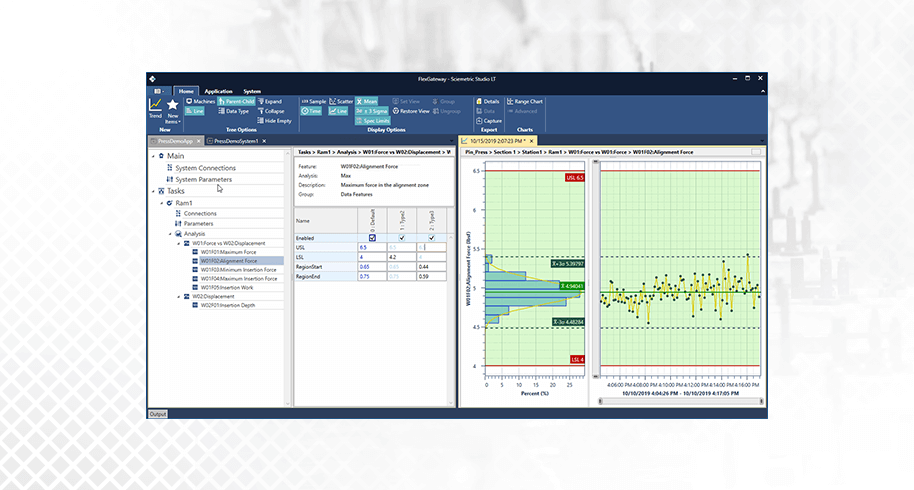
Limit setting using SPC-based charts and capabilities
Sciemetric Studio makes limit setting simple using new SPC-based charts. Watch the video to see how it's done.
Compare data across stations and test new parameters on historical data without affecting live production
See how enhanced Advanced Trend and new Waveform Analyzer capabilities can be used to determine the most effective test limits and method(s) of analysis for continuous defect detection on your line.
Turn manufacturing data into meaningful insights
Many manufacturing data collection systems leave a gap between manufacturing data collection and action on the line. Sciemetric helps you bridge that gap by providing all the key elements necessary for data-driven decision making. Draw better insights from your data with a data management software suite that addresses critical aspects of smart manufacturing: Collect & Store, Analyze & Report, and Act & Improve.
Discover how we’ve helped other manufacturers harness their data
Unlocking data to overcome production downtime
An international agricultural machinery manufacturer faced an overwhelming amount of production data and no means of making it useful. See how QualityWorX helped them retrieve and analyze information from the line to quickly trace root cause when quality issues halted production.
For one leading automotive OEM, a reliance on end-of-line testing meant that they weren’t fully realizing the data-driven potential of a connected Industry 4.0 environment. Expanding their in-process test practices and making better use of the data they generated helped one of the world's leading automakers gain enviable quality improvements worldwide.
Use your part data to inform decision-making on the line
Once you've collected data, what's next? How can you analyze and apply the information collected from your smart factory to take action before problems occur down the line? Our e-book discusses how to use digital process signatures collected and stored from across your plant or enterprise to quickly identify root cause, increase throughput (without affecting quality), improve station performance and more.
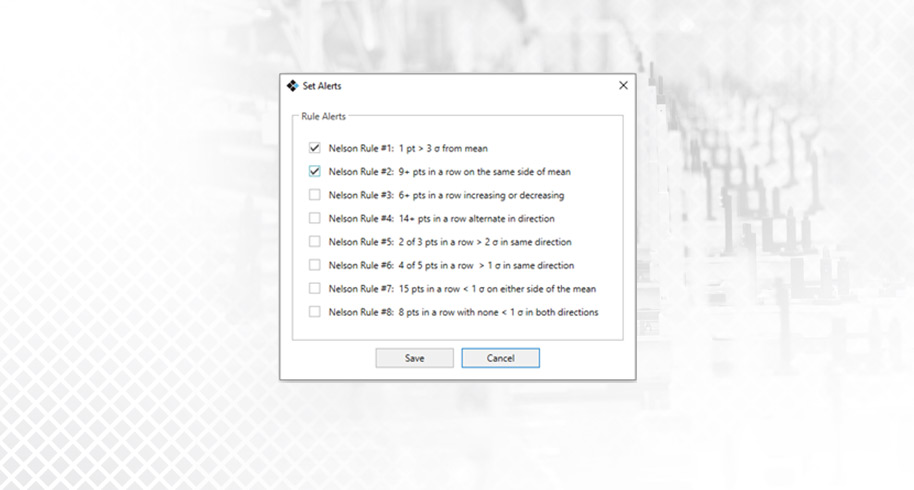
The Sciemetric Studio alerting engine provides live out-of-control data detection using Nelson rules. Alerts can be logged and sent via email if desired. You can configure which rules to apply to features and set event triggers. Watch this video to see it in action >
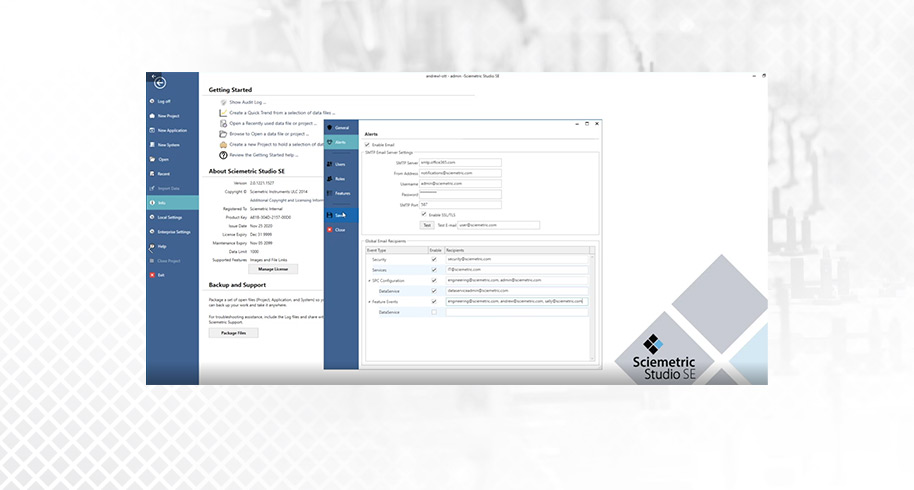
Setup and management of the alert rules are permission-based but all users can view set rules. Alert emails can be configured for various event types or the alerts can only be send to the Audit Log. Watch this video to see it in action >
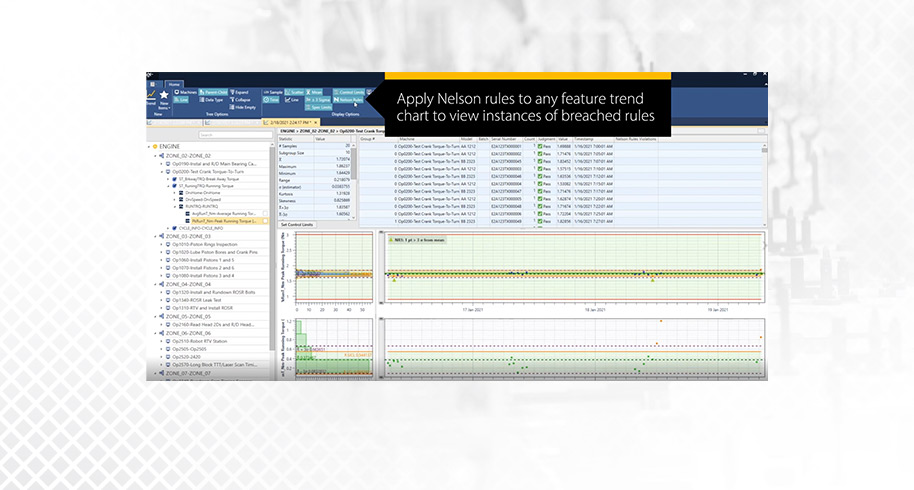
Apply Nelson rules to any feature trend chart and view instances of breached rules. User can locally set which rules to apply to the trend analysis. Watch this video to see it in action >
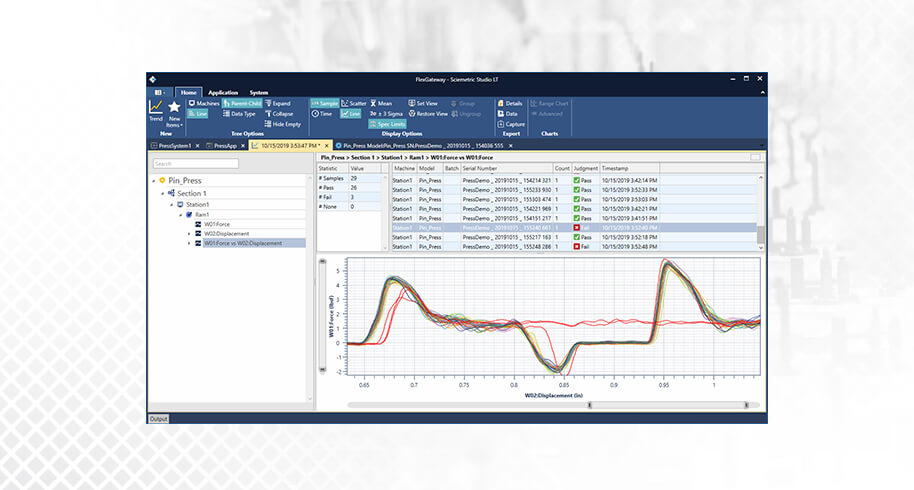
Sciemetric Studio screens displaying a waveform trend overlay to easily visualize and identify anomalies in the data to pinpoint faulty applications/processes. The anomalies (bad parts) are shown in red above, deviating from the standard, acceptable waveform. Having access to the full process waveform allows for more effective defect detection, as you catch anomalies that can occur throughout any stage of the process instead of simply at the start and finish, which can result in bad parts to go unnoticed.
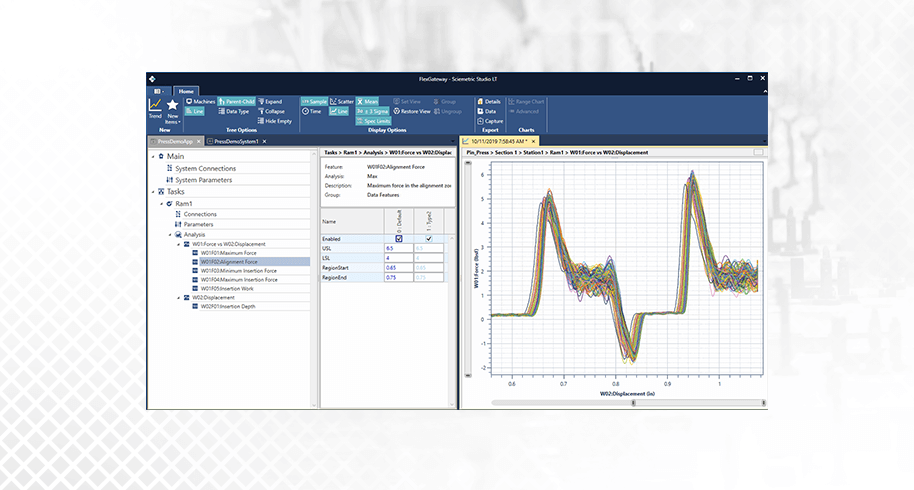
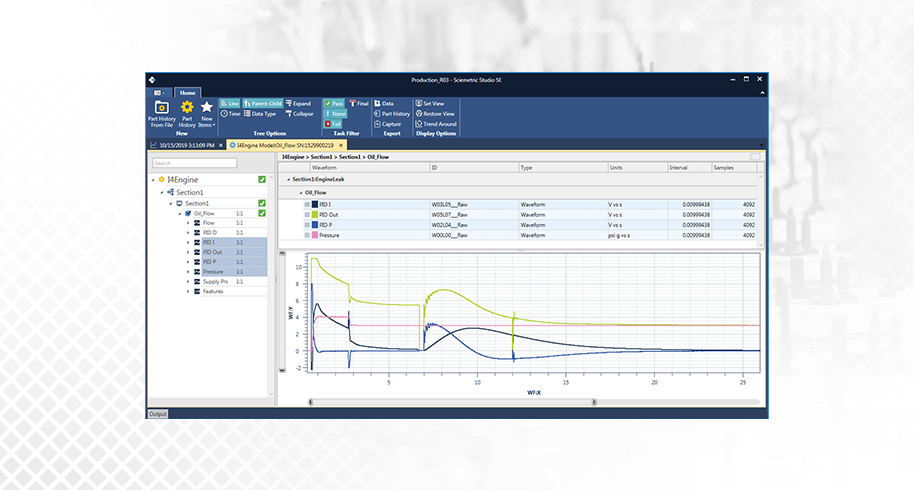
Sciemetric Studio's organized, user-friendly interface allows you to edit parameters and features of the test to better identify faulty applications and/or parts.
Sciemetric Studio's organized, user-friendly interface allows you to visualize and trend your data to better identify faulty applications and/or parts.
Sciemetric Studio allows you to overlay multiple waveform to dig deeper, analyzing part history, and specific points in the manufacturing process deemed critical to quality.